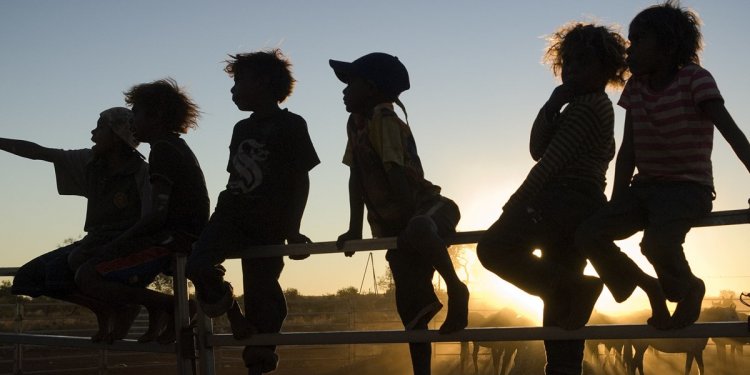
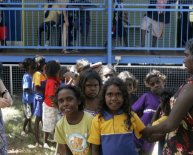
Who are the Indigenous peoples of Australia?
 Based on information from the 2011 Census, the Australian Bureau of Statistics (ABS) estimates that there were 713, 600 Indigenous people living in Australia in 2014 . NSW had the largest number of Indigenous people, and the NT had the highest percentage of Indigenous people. Indigenous people made up 3% of the total Australian population. For more details on the Indigenous population in each state and territory see Table 1.
| State/territory | Number of Indigenous people | Proportion (%) of Indigenous population living in that state/territory | Proportion (%) of state/territory population that are Indigenous |
|---|---|---|---|
| Source: ABS, 2014 | |||
| NSW | 220, 902 | 31.0 | 2.9 |
| Vic | 50, 983 | 7.1 | 0.9 |
| Qld | 203, 045 | 28.5 | 4.3 |
| WA | 93, 778 | 13.1 | 3.6 |
| SA | 39, 800 | 5.6 | 2.4 |
| Tas | 25, 845 | 5.0 | |
| ACT | 6, 707 | 1.7 | |
| NT | 72, 251 | 10.1 | 29.7 |
| Australia | 713, 589 | 100 | 3.0 |
In 2011, around one-third of Indigenous people lived in major cities .
 The number of Indigenous people counted in the 2011 Census was much higher than the number counted in the 2006 Census . This could be because:
- the number of Indigenous people has increased
- more Indigenous people were counted because of improvements in how the Census was conducted
- more Indigenous people identified as ‘Indigenous’ in their response.
In 2011, 90% of Indigenous people identified as Aboriginal, 6% identified as Torres Strait Islanders, and 4% identified as both Aboriginal and Torres Strait Islander .
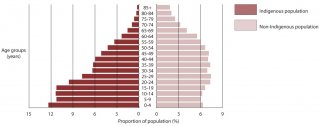
The Indigenous population is much younger overall than the non-Indigenous population. In 2011, more than one-third of Indigenous people younger than 15 year of age (compared with one-fifth of non-Indigenous people) . Almost 4% of Indigenous people were 65 years or older, compared with 14% of non-Indigenous people.
Box 1
Figure 1 is a population pyramid; it shows a comparison of the age profiles of the Indigenous and non-Indigenous populations . The bars show the percentage of the total population that falls within each age group. The general shapes of the Indigenous and the non-Indigenous pyramids are different. The Indigenous pyramid is wide at the bottom (younger age-groups) and narrow at the top (older age-groups); this shape shows that the Indigenous population is a young population. The non-Indigenous pyramid has a more even spread of ages through the population.
Share this article
Related Posts
Latest Posts


